
Subhashree Sahu and SR Bishnoi participated in a five-day online training programme organized by ICAR-NAARM, Hyderabad. Their online training experiences are shared here.
CONTEXT
In these times when huge repositories of data are being created every minute, the ability to understand how to analyse and extract the true meaning from all this collected information can become the major drivers of success. Considering the colossal volume of data generated today, we need efficient data analysis tools to derive meaning and sense out of this mass of collected data, which in turn can propel an organisation towards success. Data analysis is the process of collecting, modelling, and analysing data to extract meaningful insights that support decision making. In the case of Social Sciences too, it needs careful dissection and analysis of the collected data to derive meaning out of the same and extrapolate it to similar populations in similar settings.
There are a plethora of methods and techniques to perform analysis, which can be largely categorised into quantitative methods and qualitative methods in research. Keeping these objectives in mind, online training was conducted by ICAR-NAARM on the topic ‘Data analysis in Social Sciences Research’. This was mainly done to orient and upgrade the analytical skills of researchers and thus reorient them on the advances made in evolving scientific tools, theories and methodologies. The sessions dealt with research-worthy issues for social scientists working in the agriculture domain, such as scale development, statistical tests of significance, correlation and regression analysis, factor analysis, Introduction to R, impact assessment tools and technologies, data visualisation using tableau, application of artificial intelligence and machine learning in agricultural research. The sessions were put together well covering the basics as well as advanced topics.
The three vital modern-day concerns are: food, economy and environment. Here the role of social scientists come into play in facilitating the expression and engagement of public, consumers and stakeholder preferences, knowledge, values and motivations. Though India has achieved record food production it is still troubled with complex challenges such as low productivity and profitability, smaller share in export, poor management of bio-mass and environmental degradation, low farmers’ income, rising regional disparity, and widespread malnutrition. To address these issues, social scientists need to work in different areas of the value chain, and deal with institutional change, climate change, public policy, etc. They should employ appropriate statistical tools for analysis so as to obtain reliable and valid results, which can later go into report compilation that would be useful for various stakeholders and policy-makers. From this training programme, we were able to learn much by following statistical methods, as well as psychometric and impact assessment tools (given in Tables 1, 2 and 3). Its applicability in Social Science and precautions to be taken while performing the tests are discussed below.
STATISTICAL METHODS FOR SOCIAL SCIENCES
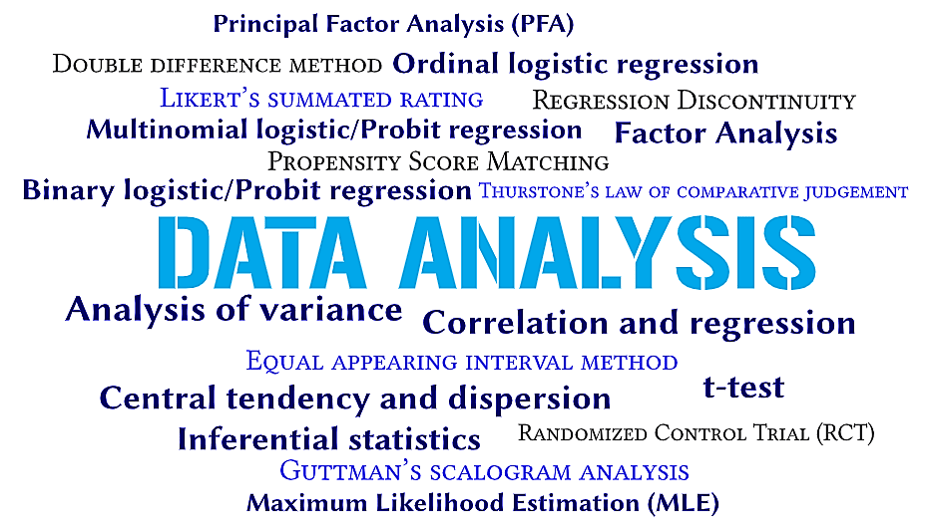
Table 1. Statistical methods for cross sectional data analysis
| Tests | Purpose |
| Descriptive statistics, such as measurement of central tendency and dispersion | To describe a population or a sample |
| Inferential statistics | To generalize our results onto a wider population |
| t-test | To determine if there is a significant difference between the means of two groups, or to test if the mean value is significantly different from hypothesized value |
| Analysis of variance | To determine if there is a significant difference between the means of three or more groups |
| Correlation and regression | To study the association between two or more variables |
| Binary logistic/Probit regression | To model the relationship between a set of predictors and a binary response variable |
| Multinomial logistic/ Probit regression | To examine the correlates of a dependent variable, where the dependent variable has more than two categories |
| Ordinal logistic regression | To model the relationship between an ordered dependent variable and a set of explanatory variables |
| Factor Analysis | Data reduction technique, find inter-relationships among a large number of variables |
| Principal Factor Analysis (PFA) | To reduce a large set of variables to a small set without losing the information from the large set |
| Maximum Likelihood Estimation (MLE) | Alternative estimation strategy to the Ordinary Least Squares (OLS), which performs better than OLS under certain conditions |
Applicability in Social Sciences
Hypothesis is the expected relationship between the variables based on theoretical expectations or literature. Hypothesis – either accepted or rejected – is based on statistical analysis. Parametric tests are those which are based on assumptions about the distribution of the population from which the sample is drawn. The assumption is that the population is normally distributed. Non-parametric tests are applicable on such data collected from a sample that does not follow a specific distribution or are ‘distribution-free’. A t-test is a type of inferential statistic, used as a hypothesis testing tool. A t-test looks at the t-statistic, the t-distribution values, and the degrees of freedom to determine the statistical significance. Statistical tests of significance measure the degree to which our results can be obtained due to chance. The application of types of logistic regression is based on the type of dependent variable used in the study. Logistic regression can be used even in case of absence of normal distribution. In case of normally distributed data, Probit model is preferred. Factor analysis can be applicable in cases where we try to find out the inter-relationship between many continuous variables. The number of factors is decided and then the factor scores are calculated which is commonly done through regression. The factors are rotated in order to have a clear observation of allocation of the variables into factors. The rotation was either Orthogonal (Varimax technique) or Oblique (Promax and Oblimin techniques). Bartlett’s sphericity test and Kaiser-Meyer-Olkin (KMO) test are used to measure the sampling adequacy of cross-sectional data, likewise Cronbach’s alpha was employed to measure the reliability of the instrument. In Social Sciences, two different types of factor analysis are commonly used, namely Exploratory and Confirmatory factor analysis. When the data is not following normal distribution, one can go for PFA method, whereas MLE method can be used for the data assuming normal distribution.
Precautions to be taken while performing tests
Type I error, denoted by the term α, is a serious concern while testing a hypothesis. It indicates that the null hypothesis was rejected, even if it was true. We need to keep in mind that the basic assumptions for employing many of the statistical tests are linearity, normality, independency and homoscedasticity. After carrying out the regression, we also need to check the detailed regression diagnostics by ensuring the normality of the residuals using Normal Q-Q plot or non-parametric tests such as Kolmogorov Smirnov test, Shapiro Wilk test; testing for independence of errors using Durban Watson test, checking for outliers, and presence of multi-collinearity. As a rule of thumb, a minimum of 60 observations or 25 observations per predictor, whichever is higher is taken in logistic regression. In logistic regression, we test the goodness of fit applying Area under curve (AUC), Somer’s D or Kendall’s Tau test. In case of factor analysis, care has to be taken to confirm that a well-defined factor should have at least three high-loading variables. If there are less than three, there will be chances of multi-collinearity or over extraction. Outliers have to be removed. It is very important to give appropriate name to the factors which make the entire exercise fruitful. A rule of thumb says that a sample size of 300 is good, 500 is very good, and more than 1000 is excellent.
PSYCHOMETRICS IN BEHAVIOURAL RESEARCH
Social scientists need to measure the behavioural components, the invisible constructs, such as intelligence, innovativeness, etc. For this, they need various psychological measurement tools or scaling technique. Scale is referred to a set of items to which an individual responds by expressing degrees of agreement or disagreement or some other mode of response. The tests and purpose given in Table 2 were learned in the training sessions along with the scale construction procedure. The first step being Item generation, where we generate the set of statements representative of the construct through literature review and expert opinion. In the second step comes item analysis, where the statements are edited as per the 14 criteria suggested by Edwards and Patrick (1969). Likert developed the concept of discriminatory power of a statement, i.e., the statement can well discriminate between the people of low and high scoring group. The third step in scale construction is to check the reliability and validity of the developed scale. Reliability is the accuracy or precision of a measuring instrument, which can be ensured by test-retest method/split-half or odd-even method/parallel forms. Validity is to check if the developed instrument is measuring what it is intended to measure. It can be checked by calculating the average variance extracted or through confirmatory factor analysis. The final step in scale construction is scalogram analysis for checking the uni-dimensionality through Cornell technique or Good enough technique to get the coefficient of reproducibility.
Table 2. Psychometric tests in behavioural research
| Tests | Purpose |
| Thurstone’s law of comparative judgement | To measure the perceived intensity of physical stimuli, the measurements represent how we perceive things, rather than being measurements of actual physical properties. This kind of measurement is the focus of psychometrics. |
| Likert’s summated rating | To measure respondents’ attitudes by asking the extent to which they agree or disagree with a particular statement |
| Guttman’s scalogram analysis | It is designed to assess subjects with respect to an attribute, it is a single (unidimensional) ordinal scale for the assessment of the attribute, from which the original observations may be reproduced. |
| Equal appearing interval method by LL Thurstone and EJ Chave | The attitude involves a continuum ranging from the strongest possible appreciation of a value at one extreme to the strongest possible depreciation of that value at the other. Thurstone devised a scaling procedure which attempted to divide any given attitude into a number of equal appearing intervals, and so gives respondents a scale-value according to their responses to the statements in a particular attitude or value-set. |
IMPACT ASSESSMENT TECHNIQUES
A few impact assessment techniques used in social science research are given in Table 3.
Table 3. Impact assessment techniques
| Tests | Purpose |
| Propensity Score Matching | PSM aims to minimize the selection biases due to observables. In most observational studies there is no counterfactual outcome, as the treated group and control group differ with respect to many variables. PSM aims to create the counterfactual by matching the similar units in treatment and control groups and then estimating the impact. |
| Double difference method | Difference-in-differences is an analytical approach that facilitates causal inference even when randomization is not possible. It is a quasi-experimental approach that compares the changes in outcomes over time between a population enrolled in a programme (the treatment group) and a population that is not (the comparison group). It can be seen as a combination of with-without and before-after comparisons. |
| Regression Discontinuity | The regression discontinuity (RD) design is considered to be the closest to a randomized trial that can be applied in non-experimental settings. The design can be used if the treatment assignment is based on a cut-off point on a continuous baseline variable. |
| Randomized Control Trial (RCT) | Impact evaluation technique where a researcher is randomly assigned to either treatment(s) or the control group. |
Applicability in Social Sciences
In Social Sciences, it becomes imperative to isolate effect of the intervention, i.e., Impact. Quantitative impact assessment can be ex-ante or ex-post. The above table lists out the commonly used impact assessment methods in Social Sciences. Ex ante impact analysis refers to what can be used to answer “what if?” questions about the expected effects of changed policies on the economy. So they model the expected effects of policy change; but they do not measure the effects of such changes after they have happened. The econometric techniques used to assess the impacts of specific research and innovation policy interventions focus on limited groups of beneficiaries (together with control groups/non-treatment groups) and changes in their performance. Understanding the counter-factual in order to estimate the net effect of an intervention is often the most challenging part of the analysis.
Precautions and considerations while employing impact assessment tests
The aim of impact assessment techniques is to isolate the effect of the treatment from other confounders. In the case of RCTs, care should be taken that randomisation is done over a sufficiently large sample (general thumb rule is the sample size should be greater than 10 percent of the population) by theory, so that the treatment and control groups would be similar on average. Then, we are advised to do a balancing test on the key variates and if the groups are not balanced, we have to go for stratified randomisation. The sample size can be estimated based on power calculation. Generally, we fix power at 0.8. We have to take care that there is no spillover or contaminations during the conduct of these trials. For RCT, we need to register the experiment before going for the experiment, submit a pre-plan analysis and procure ethical clearance. In propensity score matching method, aim is to match the participants with the non-participants based on the key variables through various techniques such as Nearest neighbour matching, Caliper or radius matching, Stratification matching and Kernel or local linear matching. While interpreting the results, we look for ATT (average treatment effect on treated). But the problem with this is that it is not robust with small samples. With regard to the regression discontinuity design (RDD), which is a quasi-experimental technique, the assignment is determined by a threshold or cut-off point. The assignment variable (for example, land holding) should be a continuous variable. It is assumed that the potential beneficiaries just above and below cut-off points are similar, and then the outcomes for both are compared. We can use Sharp RDD and Fuzzy RDD method carefully based on the presence/absence of a clearly defined cut-off score, respectively. The limitations of RDD are limited generalisability, lack of clarity in the eligibility criteria and problems in case of fewer observations.
DATA DRIVEN DECISION MAKING (ARTIFICIAL INTELLIGENCE, MACHINE LEARNING, INTERNET OF THINGS)
Nowadays, Artificial Intelligence is finding its place in guiding farmers through the entire process of cultivation, right from sowing till harvesting and sale of the produce. We learned that machine learning is a sub-set of AI, which includes technologies to figure out things from the data without being explicitly programmed to do so. Deep learning, in turn, is a sub-set of machine learning, which solves more complex problems by using multi-layer neural networks. In any machine learning (for instance, Artificial neural network) three main types of learning techniques were administered – supervised, unsupervised and reinforced. For modelling, three sets of data are generated: Training data (minimise error functions), Testing data (Optimising the parameters), and Validation data (unseen data, forecast from the sample). We can find increasing use of AI in agriculture in the form of robotics for precision agriculture, drones for assessment of crop loss, crop yield estimation, assessing the amount of crop insurance, detection of illegal fishing, crop health monitoring, livestock monitoring, etc. Microsoft and ICRISAT have jointly developed an AI-enabled app (AI Sowing app combined with personalised village advisory dashboard for Andhra Pradesh), which gives advisories to farmers on the best dates to sow, seed treatment and soil test-based fertiliser application. Similarly, it was interesting to know that NITI Aayog and IBM is also releasing advisory on similar lines regarding pest warning, yield prediction using data gathered from remote sensing satellites, soil health cards and IMD data. The concept of ‘Internet of Things’ (IoT) has got traction at present in agriculture, where it is being applied in Precision Farming, Livestock Monitoring and Cloud Computing (for example, ICAR’s Krishi Megh).
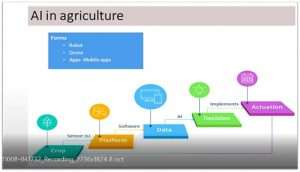 Figure1. Use of Artificial Intelligence in agriculture
Data visualisation holds great importance for social scientists. Presentation of data in a pictorial, graphical format or any visual format makes it way more understandable and appealing to readers. Three things that make good data visualisation: Accuracy, Story, and Knowledge (ASK). Some popular data visualisation tools are: Microsoft Excel, Power BI, Plotly, Google charts, etc. We were thrilled to learn about the use of Public Tableau, a freely available software, in data visualisation. There is also a paid version of the software called Desktop Tableau. It can be used for development of dashboard, and basic GIS mapping with a few clicks. It may prove very helpful for researchers in producing interesting publications and eye-catching reports.
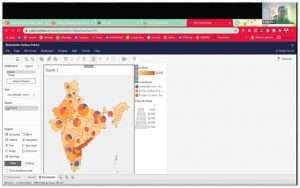 Figure2. Desktop Tableau
CONCLUSION
The ultimate aim of data analysis in research is to present accurate and reliable data. Researchers must possess more than a basic understanding of the rationale for selecting one statistical method over another to obtain better data insights that can also be acted upon. The main concern is to avoid or minimise the common issues encountered in statistics such as low sample size, presence of outliers, multi-collinearity, missing data, data altering, data mining, or developing graphical representation. The sample size for research should be reflective of the study objectives and variables. The administration of robust statistical methods can serve social scientists in bringing out quality research papers, blogs, periodicals, popular/technical articles and others.
 Subhashree Sahu, Scientist, Agricultural Extension, ICAR-IARI, New Delhi- 110012. She can be reached at subhashree28191@gmail.com
 SR Bishnoi, Scientist, Agricultural Extension, ICAR-IARI, New Delhi- 110012. He can be reached at srext2011@gmail.com


Add Comment