

In this blog, Aditya and Bhuvana elaborate on the pros and cons of using software in qualitative data analysis. The blog also discusses the basic functionalities of the ATLAS.ti software.
CONTEXT
Different data types can be used for qualitative research — interview transcripts, observations, audio/video/pictures — and the researcher’s role is to draw inferences by following systematic methods. The usual approach is to use codes, which extract meaning from the data and then categorize codes into themes and then derive results based on coding of the systematic data. One can do coding manually, either on the printed page or on a word processor, or do coding with the help of Computer Assisted Qualitative Data Analysis Software (CAQDAS). The three most commonly used CAQDAS are ATLAS.ti, MAXQDA and Nvivo. In this blog we will elaborate on the use of CAQDAS, using ATLAS.ti as an example.
The purpose of using software in qualitative research is diametrically opposite to that in the case of quantitative research. In quantitative, the main use of the software is to calculate different statistics which describe the data, and then to run any statistical model needed to answer the research question. The role of the researcher here is to only specify the model, and the variables. In qualitative studies, however, the researcher him/herself is a research tool; analysis is a process of describing the perspectives of participants using the data. So, the researcher has to draw meanings and inferences from the subtle statements or observations, which cannot be done by a software. So, the software is merely an organization tool, to document the process of drawing inferences from the data.
With this as the background, let me put forward the arguments for, and against the use of CAQDAS . Bryant and Charmaz has pointed out that Glaser (‘The Discovery of Grounded Theory’, 1967, co-authored with Strauss) opposed the use of computer software in qualitative research. His argument was that computer software will take away the creativity of the researcher. Becker argues that qualitative research requires a lot of inductive thinking — creating codes, generating meanings from statements, categorizing the codes and identifying patterns — and computer software can oversimplify this process, resulting in superficial and descriptive studies, devoid of theory development.
There is a counter argument in favour of CAQDAS as well. In qualitative research, most methods follow an emergent design (data collection and analysis go hand in hand, the codes and categories could change over time); so it is important to keep track of the entire process. Software makes it easy to organize codes, categorize them, as well as create and visualize relationships. Personally, having used both approaches — manual and CAQDAS — I feel using the software is extremely useful and saves time. Another distinctive feature of qualitative research makes it even more important as many qualitative studies follow emergent design, the entire research process is flexible as opposed to a structured research design where everything is planned in detail before the start of the survey and a new emerging idea could change the entire coding scheme, forcing the researcher to go back and start coding all over again. Software can be helpful not only to change coding schematics easily, but also to help with documenting the changes made, which is one of the important evaluation criteria.
Personally, I prefer to sit on the fence, not leaning on either extreme. CAQDAS can be a very helpful tool, but it is important to know its limits. Then only can we make the best use of it. Remember, researcher is the tool, software is just to assist the researcher, and to keep an audit track.
INTRODUCTION TO ATLAS.ti
At this point, let us take a quick look at ATLAS.ti, one of the most widely used CAQDAS. ATLAS.ti is not an open source tool, it is a paid one and the subscription plan is available on its website. For learning purposes one can download a trial version, valid for five days.
Steps to Start with ATLAS.ti
ATLAS.ti Installation: Browse the website https://my.atlasti.com/ and sign up for the software by providing your email and password. If you are already signed up then login to tour the ATLAS.ti account. Once you sign up, you will receive an email confirmation on your registered email id, where you need to complete the registration by providing your first name and last name. You will be directed to a screen – as shown in Figure 1– where it will ask you to activate the license if you have purchased it. If you don’t have a key, then you need to get a license by purchasing from the given red cart. Before purchase, one can explore the software by getting the trial version which is given next to the red purchase cart.
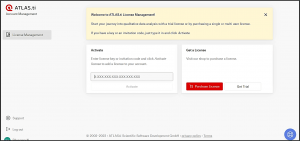 Figure 1: ATLAS.ti license management screen
Creating a new project: Once the software is installed, the first step is to create a project. A project is a set of data, codes, and memos related to a particular research project. Click on the file symbol and add project (Figure 2), give it a name, and don’t forget to add comments. In comments, usually the description of the project is provided in detail. If the project files are shared with someone else, they should be able to follow it easily.
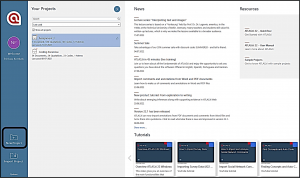 Figure 2: Creating a new project in Atlas.ti
Adding documents: Within a project, there are different categories – documents, codes, memo, networks, etc. To add a document to the project, click on either ‘add file’ (can be used to add a single file and allows different formats) or add folder (which can be used to add multiple files at once) (Figures 3 and 4).
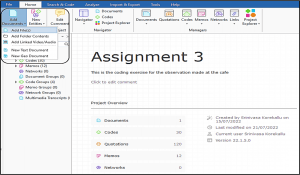 Figure 3: Adding files to a project
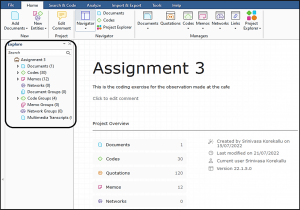 Figure 4: The different elements of the project
Coding: It is a way of labelling the data so that the themes can be identified. The process of coding entails reading the document, identifying the relevant segments, if needed marking the quotation and adding the relevant code. There are different ways of coding — open coding, axial coding, theoretical coding, etc. But discussion on those methods is beyond the scope of this blog. To add code for a piece of text, select the portion of the text and click on add code (Figure 5). One can create a new code reflecting the text or add a code which is used previously (Figure 6). In vivo coding is also possible, which uses the exact word in the text as a code. See the attached screenshot, for an example.
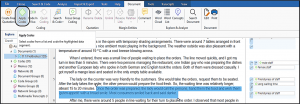 Figure 5: Applying code to quotation
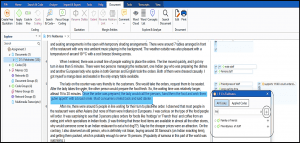 Figure 6: Applying code, either by typing a new code or using a pre-existing code
Grouping codes: One important aspect of coding that must be kept in mind is that the codes should be unique. It is ok to add more than one code to a fragment of text, but the codes should be independent and clearly defined. Soon after creating a new code, right click on the code, click on edit comment and define the code (Figure 7). Definition doesn’t mean an established definition of the term; it should be a description of what the researcher means when using that specific code (Figure 8). This can be done through ‘edit comment’ option for each code. Once the coding is completed, the codes relevant to a particular theme can be grouped. To do this, click on the code manager, select the relevant codes by holding shift button and right click to create categories (Figure 9). As before, use the edit comment option to add a description of the category.
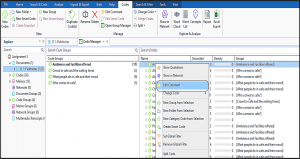 Figure 7: Adding comment to the created code
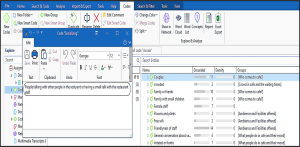 Figure 8: Adding description to the code using ‘edit comment’ option
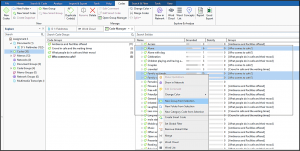 Figure 9: Grouping the codes into categories
Relationships: In the text, sometimes one fragment of the text has a connection with another fragment — support/oppose/justify/contradict, etc. — and this can be indicated through the ‘relationships’ option. Right click on the first fragment of the text, select as source (Figure 10). Click on the second related fragment and then add target, with appropriate relationship type (Figure 11). At the end, these relationships can be visualized in the form of a network.
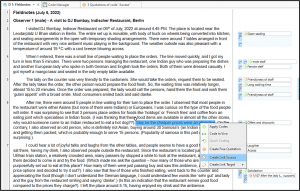 Figure 10: Adding relationship between quotes – creating source
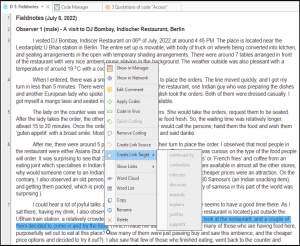 Figure 11: Adding relationship between quotes – adding target
Memos: Memos are any piece of additional information related to the research project; it could be an observation made in the field or the emotion of the speaker as evident in the body language while carrying out the interview or researchers’ thoughts on the emerging framework or underlying theory. Memos are the skeletons of qualitative research and the researcher should remember that ‘writing is a form of thinking’. Atlas.ti provides an option for adding memos to the project, and as before, don’t forget to add a description (Figure 12).
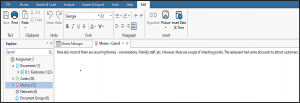 Figure 12: Writing memos to help in analysis
Exporting the results: In a typical piece of qualitative research, counting words or codes don’t carry much meaning. The result is nothing but a deeper and conceptual explanation of the underlying phenomenon. Codes and emerging categories, along with bits of quotes help researchers to build the narrative. Coding schematics is an important part of research. However, software can only provide a list of categories, codes with quotes in either Excel or Word. There are no hard and fast rules to bring them into a presentable form; so it is left to the creativity of the researcher. To export the results in Word or Excel, click on the codes and then export results to Word (Figure 13). Select the details that you need in the report and click ‘export’.
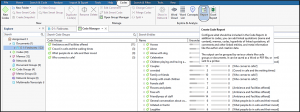 Figure 13: Exporting the reports of analysis
Word cloud: Word clouds are a popular way of visualizing the common words used in a documents. Atlas.ti can be used to generate a word cloud of the entire document or just a selected fragment (Figure 14). It also has the functionality of a stop list, which acts as a filter to remove irrelevant words (Figure 15).
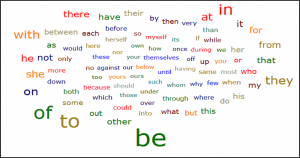 Figure 14: Creating a word cloud for visualization
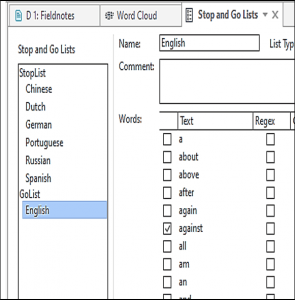 Figure 15: Creating a stop list to filter words in a word cloud
Exporting project bundle: The Atlas.ti software saves all the projects in the program files, which isn’t readable from a different system. If one wants to use them in another system, the option is to export the project bundle, which can be done by clicking on the file menu, and then exporting as a project bundle (Figure 16). It is also a good practice to save project bundles at frequent intervals so as to avoid any accidents, and minimise the chances of losing all the progress made.
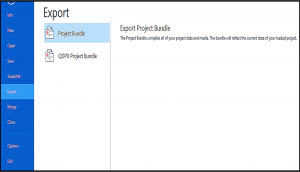 Figure 16: Exporting the project documents as a bundle
Further learnings: There are many advanced options in Atlas.ti, such as code co-occurrence network, creating secondary codes, network diagrams, etc. There is also inter-coder mode, which helps two or more persons to code the same document. But very few researchers use inter-coder agreement as an evaluation or robustness criteria, to allow the inter-coder mode to help estimate the inter-coder agreement. These tools can be used depending on the research method and demands of the research question. Furthermore, search and code functionality of Atlas allows for automatic coding based on Artificial Intelligence, where the software will suggest different codes to be used. However, personally, I wouldn’t use this, as Glaser predicted, this could lead to dry and shallow descriptions without any latitude for the researcher’s creativity.
END NOTE
This blog is only an introduction to the most basic functions of the ATLAS.ti software. There are many video tutorials which you can access directly from the Atlas software, as well as many YouTube tutorials. The advanced functionality of the software can be learnt through these sources.
Bibliography
Bringer JD, Johnston LH and Brackenridge CH. 2006. Using computer-assisted qualitative data analysis software to develop a grounded theory project. Field Methods 18(3):245-266.
Bryant, A. and Charmaz, K. (eds.) 2007. The SAGE Handbook of Grounded Theory. London: Sage.
Friese S. 2014. Qualitative data analysis with ATLAS.ti. London: Sage.
Hwang S. 2008. Utilizing qualitative data analysis software: A review of Atlas.ti. Social Science Computer Review 26(4):519-527.
 Aditya KS is a PhD Scholar at Humboldt University, Berlin, Germany, and a Fellow of Netaji Subhas ICAR-International Fellowship. He is also a Scientist (Agricultural Economics) at the ICAR-Indian Agricultural Research Institute, New Delhi. His research interests: impact assessment of agricultural technologies and natural resource economics. He can be contacted at adityaag68@gmail.com.
 Bhuvana N, PhD in Agricultural Extension from Professor Jayashankar, Telangana State Agricultural University, Hyderabad. Her research interests include organizational ecosystems and effectiveness, social networks and technological change. She can be reached at bhuvanaditya7@gmail.com.


This sequel blog introduces the reader to the application of software for qualitative data analysis. Nice to see that the blog outlines the basic aspects of Atlas.ti. The Illinois State University Library also offers a number of open source options in this regard. Have a look https://guides.library.illinois.edu/c.php?g=348074&p=2346107