Tablet-/smart phones-based surveys are better than paper-based surveys as they make it easy to monitor data collection on a real time basis. Also, it saves time in data entry as the collected data is directly retrieved in the form of Excel sheets. In this blog Aditya KS, Subash SP and Bhuvana N discuss survey data collection using computers, tablets and smart phones. A detailed step-by-step explanation on using Kobo Tool Box – an open access resource for collecting survey data using tablets/mobile phones – is also provided here.
CONTEXT
Surveys are the bread and butter for any type of researcher in the social sciences; be they students (Masters and PhD) or researchers, or organizations, such as the National Sample Survey Office (NSSO), which carry out large surveys for tracking different socio-economic characteristics. Research in the field of social science is mostly observational (except when it uses experimental approaches) and a researcher has no control over the events. The data is collected as they are observed and analyzed to draw conclusions, and the researcher has to depend on either secondary or primary data to draw inferences. As most of the secondary data sources are either macro level aggregates or not suitable to address the specific research question under consideration, primary surveys are inevitable in most research projects. Primary surveys offer flexibility to the researcher to understand different socio-economic and cultural perspectives related to the research problem.
From the perspective of a social scientist in Agriculture (Agricultural Extension or Agricultural Economics), primary surveys are a strategic tool for assessing the demands, aspirations, priorities and challenges of farmers and other stakeholders in agriculture. They are also important for understanding the target population while planning extension intervention or designing policies. Further, surveys are equally important in assessing the impact of interventions (technologies or policies).
SURVEYS
The history of survey-based data collection goes back to Seebohm Rowntree’s first poverty survey in 1899 at York, England (Careletto and Gourlay 2019). Over the years household surveys evolved rapidly. Simultaneously, the evolution of technological aids in surveys – to make it easier and reduce errors – are also progressing. In the next section, we talk a bit about the problems of paper-based surveys before discussing how to do a survey without paper (super cool and ecofriendly too!!).
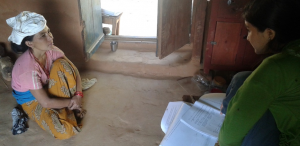
A paper-based survey in the mid-hills of Nepal. ©Subash
Paper-based survey
Traditionally, surveys use paper-based questionnaires. A set of questions (Structured or semi-structured) are developed based on the research problem and printed on paper (a lot of sheets). Enumerators (surveyors) go to the field and record responses on the paper sheets, which later gets digitized through a data entry process. This is a cumbersome process as it takes quite a lot of time and has several problems and challenges associated with it. For instance, data entry can take a long time and many human errors can creep in. Furthermore, real time monitoring is difficult and often the errors in surveys are detected only after the data is entered and tabulated. By that time, it is too late to do anything about it. Using computer/tablet or mobile-assisted surveys can help to overcome these. We will discuss the advantages of computer-based surveys vis à vis paper-based ones in the later part of this blog.
Computer-Aided Personal Interviews (CAPI)
Technological advancements have changed the way surveys are carried out now. Computer-Aided Personal Interviews (CAPI) is one such technological advancement in data collection (satellite and big data are the other advancements). CAPI is a face-to-face data collecting method in which the enumerator uses a small computer, or a tablet, or a smart phone to collect the data. Availability of hardware (like inexpensive computers, tablets and smart phones) and software (both paid and Open Access) has made it easier to carry out CAPI surveys. This is helpful for two very important reasons:
- No need for data entry process to digitize the information as in paper-based surveys;
- Real time data monitoring to minimize errors.
There are many software tools available that are customized to carry out face-to-face surveys. There is a wide variety of software tools to choose from, and they can be used by people with no programming knowledge (like us!). They are increasingly being used by researchers in organizations, such as the World Bank, and CGIAR institutes.
The latest Period Labour Force Survey (PLFS) carried out by NSSO used CAPI for data collection. ICAR-National Academy of Agricultural Research Management (NAARM) and PJTSAU, Hyderabad, undertook a consumption survey of Telangana State using CAPI in 2017 (Kumar et al. 2017). There are several advantages and disadvantages with CAPI which we will discuss here. (The advantages and disadvantages given here are based on DIME 2020 and our own experience.)
Advantages
- The collected data gets digitized immediately and sent to the server. In places with good networks we could carry out high frequency checks (cross checking the responses on a daily basis). Real time monitoring is really easy unlike paper surveys, a person sitting in the office can cross-tabulate all the responses and test for data consistency.
- Enumerators can be monitored in case of larger surveys. The start time, end time, GPS location can be automatically recorded and supervisors/researchers get to see it. Even the interviews can be randomly recorded (without the knowledge of enumerators) and later verified by supervisors/researchers.
- It’s easy in case of questions with skip logic – goes directly to a different set of questions based on the response to a previous question (e.g., If yes then…? And if No then…?).
- Do calculations and conversations easily by using inbuilt calculators (for instance Bigha to Hectare, and so on).
- Collect data, such as images, farm plot sizes (GIS-based plots), and qualitative data (record statements).
- Avoid errors in data collection (missing questions) and data entry (most common errors).
- Data validation can be incorporated, for example, farming experience cannot be more than the age of the farmer. Such conditions can be imposed while preparing the survey itself to avoid the errors.
In a nutshell, CAPI offers many advantages in terms of features to reduce data collection errors. Irrespective of these advantages, there are certain disadvantages, rather challenges, in using CAPI.
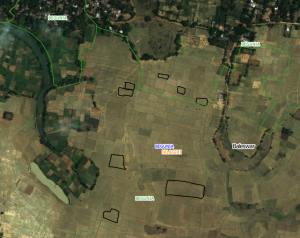
Satellite image-based plot data ©Yashoda, IRRI
Disadvantages
- Respondents may not be comfortable with CAPI-based survey. They get suspicious and often distracted seeing the gadgets. (At some rural villages in Byndoor district of Karanataka, our enumerators were forcibly locked up in a room and we had to get police help to get them out. The community was not very open to outsiders and using tablets made them even more suspicious. Gram panchayat election was also close at hand!- Don’t worry such situations won’t happen all the time.
- Need trained enumerators (longer training periods) with a bit of knowledge on handling gadgets.
- Difficult to carry computers and tablets in crime-ridden areas (Risk of theft is there – in one of the surveys it happened to us).
- They also require electricity (back up batteries can help) and good network connectivity (although data could be uploaded to a server once a week or later in a place with good connectivity).
- Developing the questionnaire in CAPI is time-consuming compared to paper-based questionnaire (though the overall time saved is unquestionable).
- Language restrictions (unlike paper-based surveys, CAPI has limited options for developing the questionnaire in local languages).
Software and Hardware essentials to carry out CAPI survey
We have different software available for CAPI surveys. A list of commonly used ones are given in Table 1. Each of them have their own set of advantages and disadvantages. A detailed discussion on each of them is beyond the scope of this blog. Keeping in mind that many of our readers would like to know about the open source options to carry out CAPI surveys, we have provided a detailed step-by-step guide to use Kobo Tool Box, a free and open access software to carry out CAPI surveys. However, if the researcher has money to go for paid software, he can always buy one.
Before starting our discussion on Kobo, let us try to understand a few points that must be kept in mind while choosing the software and hardware for CAPI. Some of the important questions to be asked while selecting software are:
- What kind of data is needed (text, pictures, audio)?
- How are they managed (does it require its own server?)?
- What is the output file format (most of them have multiple options)?
- Does it have language support (native language questionnaire)?
Similarly, while choosing the hardware (tablet/computer/smartphone), first, the hardware should be compatible with the software requirements; and it also calls for a good quality camera (if pictures are to be recorded). Further the size of the screen depends on the length of the questionnaire (for shorter questionnaires smart phones are fine, but for larger questionnaires tablets with 7-inch screens are preferable). The hardware should also have enough internal memory (8 GB preferably) and external storage (SD cards), the gadget should also be GPS enabled with better accuracy (10-15 meters), and good battery life.
It is a good practice to purchase tablets at the institute level. However, there is also an option to rent them. If the organization is involved in frequent surveys, it can also purchase cloud storage to store all the survey data at one place. However, the point is that, under resource constraints, android mobile phones are enough to carry out a CAPI survey. The table below provides a snapshot of a few software options for CAPI surveys.
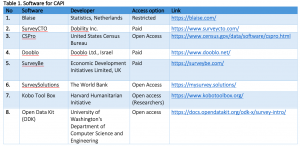
Refer this for Open Data Kit (ODK )
As stressed, even though many paid software options are available, in this blog we will focus on a very commonly used one – Kobo Tool Box – a free and open access software for CAPI survey.
Kobo Tool Box
Kobo Tool Box is an open access toolset for collecting survey data using mobiles or tablets. In this section we will elaborate on how to use Kobo Tool Box with a detailed step-by=step guide. Relevant screenshots are also provided.
- Step 1: Register as a researcher at Kobo on the following link https://www.kobotoolbox.org/. This offers 10,000 submissions per month with 5 GB of storage space, which is sufficient for most of the surveys done in academia. After registering, please note the username carefully, you will need it later.
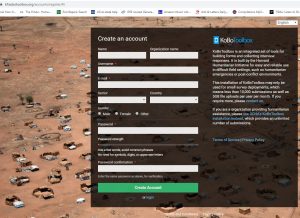
Step 1
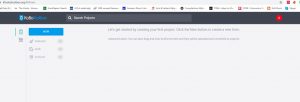
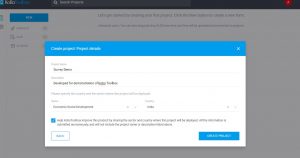
- Step 2: Login to your account and click on New to start preparing the survey schedule. Give a project name, select the suitable discipline and select the country. Click ‘Create Project’ to proceed to the next step.
Step 2
- Step 3: Click on +Add Question and select the question type. There are different types of questions available – text, numerical, select one, select many, decimal, rating, ranking, grid, date and time, etc. According to the expected type of answer, select the right question type.

Step 3
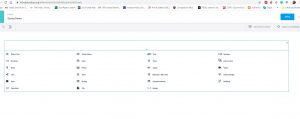
- For example, family size will be expressed in terms of whole number, hence the question type has to be numeric. In the question ‘Major Occupation’, the right question type is select one, where either ‘Agriculture’ or ‘Non Agriculture’ has to be selected. In the ‘Secondary Occupation’ question, farmer can have more than one secondary occupation, hence, select many is the right choice.
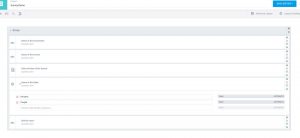
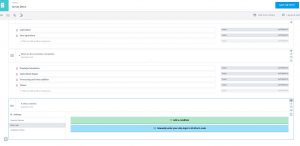
- Skip logic is another attractive feature. Based on the response to the previous question, you can impose a condition to display or skip a particular question. For instance, the question, ‘mention the other occupation’ is displayed only if the respondent has selected the ‘other occupation’ in the previous question. Or else that question will be skipped. This can save a lot of time. For instance, consider a survey involving two crops. If the farmer is not growing wheat, all the questions pertaining to wheat will be skipped if this logic function is appropriately used.
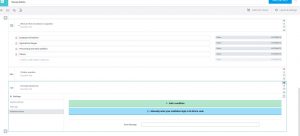
- Another useful function is Validation criteria. You can restrict the response values within a limit to avoid data entry errors. For example, the question is ‘What is the farm gate price of rice in Rs/kg?’ The answer has to be less than 50 even by conservative estimates. But, the enumerator could get confused and enter 1200 (considering it as Rs/quintal). To avoid such errors, we can use validation criteria to limit the response to less than 50. If the enumerator enters any value higher than that an error message will pop up. We can even customize the error message to remind him that the price is in Rs/kg, not in Rs/quintal.
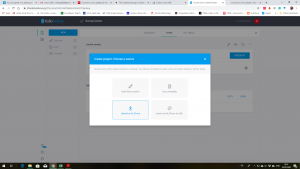
- Making the questionnaire directly in the Kobo Tool box can be time consuming and repetitive. The alternative is to prepare the questionnaire in ‘Open Data Kit (ODK)’ format and upload it directly to Kobo. Understanding the ODK format at the beginning can be a bit tricky, but it will save time in the long run. However, explaining the ODK format is beyond the scope of this blog. One sample ODK file is anyhow provided in the link below, which can be directly uploaded to Kobo (link).
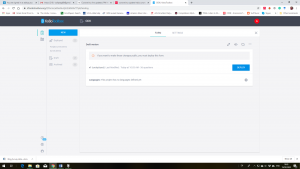
- Once the questionnaire is ready, first preview it. If satisfied, then deploy the questionnaire.
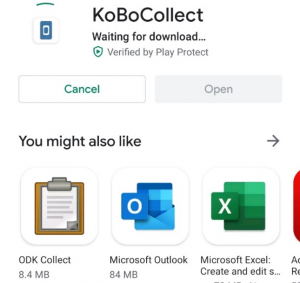
- Step 4: Next step is to download the ‘KoBoCollect’ in all the devices which will be used for data collection (preferably Android, in IOS devices Web Form can work).
Step 4
- Step 5: Once installed, go to the general setting – server. Modify the server URL as https://kc.kobotoolbox.org/username – here in the place of username, you have to input the username that you had used to create the survey schedule. For instance, in the demo survey, the username used is ‘adityaraoks’. So the URL is edited to include adityaraoks at the end.
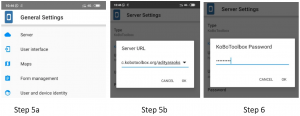
- Step 6: Enter the username and password of the Kobo account which is used to generate the survey. This is a onetime process and it won’t ask for username and password again.
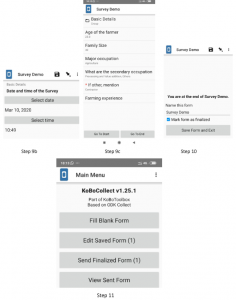
- Step 7: Click on the ‘Get Blank Form’ tab. All the surveys deployed by the respective Kobo account will be displayed. Select the survey which you want to fill.
- Step 8: Now go to Fill blank form. Here you will see the questionnaire that you had developed.
- Step 9: Now you can see all the questions – answer them till you reach the end of the survey.
- Step 10: Click on Save and Exit.

- Step 11: Once you have the internet, click on the send finalized form option. The Survey data collected will be sent to the server, which can be immediately accessed. So, the survey can be conducted even when there is no internet connection. Finished surveys can be sent at the end of the day once you have the internet connection.
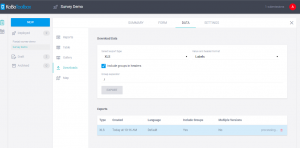
- Step 12: Next step is to access the collected data from the server. Once the form is sent by the enumerator, we can access the data by clicking on data tab. Custom graphs and tables are displayed here.
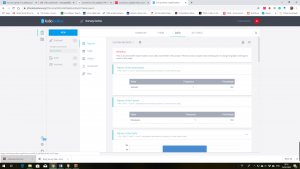
Step 12
- Step 13: The data can be downloaded in XLS format. The person monitoring the survey can check for the consistency of data by tabulating or summarizing the relevant information. Tabulating the data by enumerator can also indicate a few enumerator-specific errors in data entry. Immediate feedback can be given to the respective enumerator about the error.
Step 13
Here are a few tips from our personal experience:
- Predict the common data collection/entry mistakes. Even pre-testing can be used for this purpose. Then use validation criteria to minimize them.
- If you wish to collect the data in the form of a table, see below

Customizing table format in Kobo is difficult. It is better to group the questions – Age, Education, and Employment and repeat the groups as many times as you wish. You can use skip logic to regulate the number of times the question is repeated.
- Pre-testing of the questionnaire in CAPI is a must. Sometimes the skip logic may not work or some question/s may be incorrectly displayed or ordered. The errors can be minimized by identifying them during pre-testing.
- Tabulate the data as frequently as possible during real time monitoring. Tabulate responses by enumerator and observe for patterns in response. For instance, in a question to rank the constraints faced by farmers, if an enumerator follows a typical pattern like 3, 2, 4 and 1 for all the farmers, then there is a possibility that he might be filling responses on his own without even asking. You can talk to the enumerator about it and verify the details.
- On similar lines, another common error is ‘average value of response’. Once an enumerator finishes maybe 5 or 10 surveys, he gets a vague idea of how much fertilizer is used, what is the seed rate, etc. There is a possibility that he starts to enter those average values for all the future respondents. So, closely observe for such errors.
CONCLUSION
CAPI is emerging as an alternative to paper-based surveys. Though this method is very common across CGIAR institutes and other international research institutes, the use of these in National Agriculture Research and Education System (NARES) in India is low, to the best of our knowledge. (We request those readers who have used CAPI for their survey to share their findings and experience in the comment session.) It’s been taught in extension courses (E-extension, Advanced Research Methods) for quite some time. A common notion is that CAPI is only for larger surveys with huge funding, which as discussed is not a fact. There were several reasons, such as lack of accessible hardware, software and issues with user-friendliness, which kept them beyond the reach of researchers and students in NARES. Availability and prevalence of smartphones/ cheaper tablets and open access software which are user-friendly are opening up those doors. We strongly feel that it’s time for us to get smarter and embrace CAPI as it offers many advantages over paper-based surveys. In the initial phases this could pose some challenges, but as the saying goes ‘life without challenges is boring’!
References
Careletto C and Gourlay S. 2019. A thing of the past? Household surveys in a rapidly evolving (agricultural) data landscape: Insights from the LSMS‐ISA. Agricultural Economics 50(S1):51-62.
DIME. 2020. Computer-Assisted Personal Interviews (CAPI). https://dimewiki.worldbank.org/wiki/Computer-Assisted_Personal_Interviews_(CAPI)
Kumar S, Kumar R, Seema, Dhandapani A, Sivaramane N, Meena PC and Radhika P. 2017. Food consumption pattern in Telangana State – 2017. Hyderabad, India: ICAR-National Academy of Agricultural Research Management.
KoBoToolbox. Available online on https://www.kobotoolbox.org/. Accessed on 19-03-2020.

Aditya KS, Scientist, Division of Agricultural Economics, ICAR-Indian Agricultural Research Institute, New Delhi. Email id: adityaag68@gmail.com;

Subash SP, Scientist, ICAR-National Institute of Agricultural Economics and Policy Research, New Delhi. Email id: subashspar@gmail.com and

Bhuvana N, PhD Scholar, Department of Agricultural Extension, PJTSAU, Hyderabad. Email: bhuvana.rao7@gmail.com


Very timely blog, especially when paper based surveys are getting obsolete by each passing day. The student researchers are increasingly using online tools like survey monkey to gather data, developing attitude scales etc. Truly said, it makes collection, tabulation, analysis easier and recorded compared to paper based surveys. Some of the limitations of computer based surveys mentioned will slowly reduce ones we n the public in general get used to these modern tools. Congratulations to the authors and AESA for this blog which throws light on the emerging scenario of data collection- truly we need to be smart when we are equipped with computers, tablets & smartphones
This is a very good blog which need to be send to all researchers in social sciences. We at NAARM are mostly switching into this mode of data collection. Survey manager (Researcher) can see the data without timelag and can ask enumerator for explanation of out lair data if any. The team can give open webinar on this which can be viewed by many researchers in the field.
“Timely and well written blog. With the advancements of technologies, traditional approaches in the research are being replaced by more smart and user friendly applications. The blog rightly underscores these changes and throws light into the new tools available for researchers in the data collection phase.
However, from the reader’s perspective, a couple of questions are to be answered. Applications like Kobo toolbox are to be customized for conducting the face to face interview with the participants, as mentioned in the blog. But in the real situation, individuals from outside may interfere during the course of interview, who may give valuable inputs. How to collect such information is a concern, with the custom made application. Moreover, effectiveness of the tool in context of a Focused Group Discussion, where the responses are unstructured and randomly generated from the multiple participants is another concern. Answers to these questions may enlighten the readers.”
I am sure this type of paper less surveys will gain more popularity in the years to come for their obvious advantages. I wish the senior scientists as project leaders must use CAPI which will encourage the Ph.D students to employ them. Thanks to the authors for giving us such useful and informative blog.