
In this blog post Amitava, Shravani, Sanchita Garai and Sanjit Maiti try to elaborate on the concept of Fuzzy Cognitive Mapping and its uses and applications in Agricultural Extension Research.
CONTEXT
There is often a tendency in Agricultural Extension Research to carry out quantitative analysis rather than qualitative research. One possible reason, out of many, for this could be lack of availability of easy to use methods for gathering data, based on which appropriate conclusions can be drawn and inferences made. While in quantitative research the major focus is on deriving outputs and proving their validity as well as reliability with the use of appropriate statistical tests and fitting the data together, in qualitative research major attention needs to be put on collection and gathering of data. Validity and reliability of the data is based on whether the data has been collected faithfully and represents the viewpoint of the respondents accurately. It needs to explore local understandings of wellbeing (White and Jha 2014). There are several methods for conducting qualitative research, such as content analysis, case study research, ethnographic research, etc. However, in the last few years, the Fuzzy Cognitive Mapping approach, a most used method being System Mapping, is gaining much traction in the field of Social Science research and gradually evolving and emerging as one of the most sought after methods for capturing stakeholders’ knowledge, belief, perception, etc., for carrying out evidence-based decision making. In this blog we briefly explain what Fuzzy Cognitive Mapping is and its uses and applications in Agricultural Extension Research.
SYSTEM MAPPING
System mapping consists of two distinct words viz., ‘system’ and ‘mapping’. The first question that needs to be answered on system mapping is: What is a system? Well, that’s a tough job indeed. There have been various definitions of ‘system’ that has evolved over time. Williams and Hummelbrunner (2011), suggested a few distinctions for considering a system: (a) a system is made up of some elements; (b) elements making up the system are linked, either by process or relationships; (c) systems contain a boundary. Continuing further with this definition, by considering the concept of purpose and organization, it was defined as an ‘interconnected set of elements, that is coherently organized in a way, that achieves something’ (Meadows 2009).
‘Map’, also synonymously called ‘model’, is something that portrays or rather simplifies some aspects or perception of reality. Mapping of a system not only helps in identification of the concepts prevalent in the system, but at the same time also helps in getting comprehensive clarity on the interaction prevalent among them. Common concepts of system mapping include:
- Network: A network, in simple terms, means a system, where nodes are connected to edges. This reveals the interconnectedness of elements in the system.
- Nodes: Elements in the network are denoted as nodes. They may vary in shape, size, colour, etc., based on their classification and imperativeness.
- Edges: The connections that link the nodes in a network are called ‘edges’. They may be both directed or undirected (based on the type of connection between the elements).
There are various types of system mapping approaches, such as Bayesian Belief Network, causal loop diagrams, participatory systems mapping, rich pictures, system dynamics, etc. However, Fuzzy Cognitive Mapping approach is one of the most used and significant system mapping approaches. The usefulness of Fuzzy Cognitive Mapping was perfectly described by Barbrook-Johnson and Penn (2022), using three diagrams of conceptual spaces and positioning various mapping approaches based on overall focus and nature (Figure 1), based on their modes and ease of use (Figure 2) and based on the outputs and analysis they produce (Figure 3).
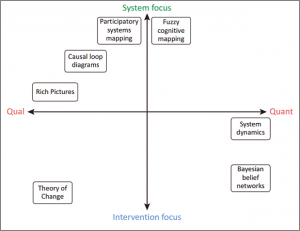 Figure1: Positing of various mapping approaches based on overall focus and nature
Source: Barbrook-Johnson and Penn (2022)
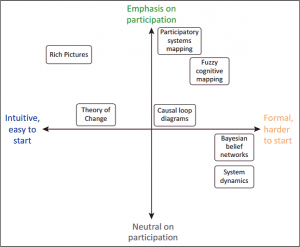 Figure 2: Positioning of various mapping approaches based on modes and ease of use.
Source: Barbrook-Johnson and Penn (2022)
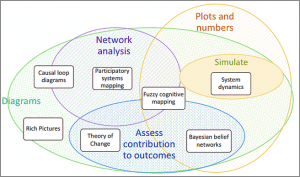 Figure 3: Positioning of various mapping approaches based on output and analysis.
Source: Barbrook-Johnson and Penn (2022)
Based on overall focus and nature, FCM stands at a point where it can be categorically described as a mixed method approach that is very focussed on explaining and detailing the existing concepts as well as interactions among them in a system. It emphasizes that participatory approaches and collection of data and critical observations of the respondents play a significant role in the analysis unlike pure quantitative methods. However, it is imperative to say, unlike many other methods and approaches, it is a bit tough at the start and needs proper skills and expertise to conduct the analysis. Considering the type of outputs and results it produces, it is nevertheless important to say that it is a method that includes all types of possible outcomes deriving from system maps. It lies absolutely in the interaction point of all types of results, such as network analysis, diagrams, plots, and numbers, assessing contribution to outcomes, etc. All these features of FCM not only makes it a popular cognitive mapping approach, but also promotes it in today’s agricultural extension research as one of the main methodologies to be used.
THE WHAT, WHY, AND HOW OF FUZZY COGNITIVE MAPPING
Fuzzy Cognitive Mapping (or FCM) is an approach of building a model of a system consisting of several boxes and its connections. Boxes are normally known as ‘concepts’ and can represent anything that can be expressed as a variable. The concepts are connected with the help of edges. Edges express the type of relationship existing between two concepts of a system. As mentioned earlier, it may be both directed and undirected, i.e., if both the concepts are influencing each other then the edge shall be undirected, however, if one is influencing the other and vice-versa is not true, the edge shall then be a directed one. It is very useful for visualizing and understanding how concepts/factors/variables etc., affect each other, while maintaining self-loop and feedback mechanism within a complex system. Data collection and analysis in FCM is seen as a quasi-quantitative approach, since quantification of concepts and their relationship is expressed in relative terms (Gray et al. 2015). It allows the participants to debate cause-effect relationship among qualitative concepts and, at the same time generate quantitative data based on respondent’s experience, knowledge, perception of inter-relationships among the concepts (Singh and Nair 2014; van der Sluis et al. 2018). The maps can be done by both individuals and groups.
Strength of FCMs, as explained in detail by Singh and Chudasama (2020), over other mapping approaches includes:
- FCMs are not driven by lack of data, it is responsible to generate data (Kok 2009; Özesmi and Özesmi 2004).
- It is able to model complex and ambiguous mechanism systems and reveal hidden but important existing feedback mechanism in the system (Özesmi and Özesmi 2004; Singh and Chudasama 2017a).
- It empowers the researcher to represent, integrate and compare the data using FCM with the help of knowledge, perceptions and experiences of diverse stakeholder groups included in the research (Özesmi & Özesmi, 2004).
- Interactive scenario analysis of FCM enables simulations of various policies, and particularly in extension-based research helps in understanding the adoption and adaptation deficit in both current and future scenarios (Kok 2009; Özesmi and Özesmi 2004; Singh and Chudasama, 2017a).
An FCM includes a number of concepts (C=C1, C2, C3, C4, …, Cn) and they are connected with the help of various edges. The links between the concepts are assigned weights (w) with values ranging between -1 to +1. The weight describes the cause-effect relationship between the concepts in the following manner:
- If w = +1, there is a positive relationship existing between the concepts
- If w = -1, there is a negative relationship existing between the concepts
- If w = 0, there is no relationship existing between the concepts.
As mentioned earlier, the direction of the edge between the concepts carries significant meaning and is of great concern during analysis of FCMs. If,
- C1 C2, C1 is the cause and C2 is the effect.
- C2 C1, C2 is the cause and C1 is the effect.
- C1 C2, both C1 and C2 is the cause and effect of each other.
SCOPE OF APPLICATIONS OF FUZZY COGNITIVE MAPPING IN EXTENSION RESEARCH
Fuzzy Cognitive Mapping, a popular and prominent way of carrying out mental modelling of the respondents, has scope with high potential in the field of agricultural extension research. Goswami & Roy (2021) explained in detail the scope of using mental modelling in the field of agricultural extension research. They are as given below.
- It is very useful in understanding as well as regulating the effects of human action in a defined system.
- It has a great role to play whenever the system is lacking critical scientific data, and there is utmost need for the professional to develop a model of the system.
- This methodology has high utility whenever there is a complex problem which needs clear solutions; however, obtaining distinct solution involves diverse stakeholder groups.
- It helps the researcher in understanding how people belonging to a particular system, individually or collectively, conceive a concept or a construct and how they ultimately link it to their decision-making process.
APPLICATIONS OF FUZZY COGNITIVE MAPPING IN AGRICULTURAL EXTENSION
Fuzzy Cognitive Mapping is a pathbreaking methodology and is gradually gaining popularity in the field of agricultural extension research, particularly in the domain of Indian agriculture. Singh et al. (2019) used FCM to elicit knowledge and to integrate perceptions of different stakeholders regarding climate change, its impact, and the efficiency of available adaptation measures in the Sundarbans region of India. Singh and Chudasama (2021) studied several pathways of different adaptation measures adopted by the smallholder farming community apropos climate change in arid and semi-arid regions across twelve districts of India. FCM was also used to measure the perceived impacts of cyclones on fisheries (both inland and coastal fisheries), and the adaptation measures adopted by them (Singh and Chudasama 2017b). Measuring perception of residents in the coastal socio-ecological system, and comparing it with respect to various stakeholder groups, in a post-disaster situation was done with the use of FCM (Furman et al. 2021). It was also used to measure the dual impacts of COVID-19 and cyclone Amphan on the coastal community in West Bengal, India (Goswami et al. 2021).
Averbuch et al. (2022) conducted research on understanding how farmers from two different social contexts (Northeast US and Denmark) made their transition towards sustainability. FCM was implemented for building a model on their practices and perceived outcomes based on their gradual move towards sustainability. Not only crop farming, FCM is a useful methodology also in the context of livestock extension. Research was conducted to measure how intensified livestock production can be a promising pathway for the smallholder farming community (Alomia-Hinojosa et al. 2022). Differential perception of households to integrate livestock as a component in their farm was also measured with the help of Fuzzy Cognitive Mapping (Murphy et al. 2021).
FCM was used in developing a participatory model, involving diverse stakeholder groups, to identify the interlinkages between the water-energy-food nexus of various integrated policies, which further helped in gaining knowledge on the nexus and contributing towards growing awareness and building consensus among involved stakeholders (Martinez et al. 2018). This methodology also held a position in demonstrating policy option analysis for an existing Social-Ecological-System (SES) with assistance from diverse stakeholder groups (Mehryar et al. 2017).
STEPS FOR CONDUCTING FUZZY COGNITIVE MAPPING
The steps for conducting FCM (Goswami et al. 2021; Singh and Chudasama 2017a, 2020, 2021) are as follows:
Knowledge elicitation
The first step for conducting FCM includes identification of the concepts already existing in the system. This has to be done through a participatory approach where certain stimulation (personal interview, focus group discussion, etc.) helps respondents to identify the concepts which they perceive to be imperative with respect to the study being done. Identification of concepts can be carried out in two steps:
- Open concept design approach: This stage focusses on generating concepts from experts, progressive farmers, etc. Identification of concepts in this phase remains unrestricted. Role of the researcher in this phase remains limited to determining the boundary for the study, while the respondents are free to identify any type of existing boundary in the system that is related to the topic. This phase is particularly useful in case there is insufficient knowledge for modelling of the system (Singh and Chudasama 2020). Questions generally asked in this approach may be cited with an example from Singh & Chudasama (2021):
- “What have been the impacts of temperature and rainfall variability and extreme climatic events on your lives and livelihoods?”
- “What adaptation interventions are being carried out in your village to reduce these impacts?”
- Pre-concept design approach: In this phase, concepts are identified and determined either by experts or researchers with the help of extensive review of literature. Concepts generated in the open design approach can also be used in this phase, if any study combines both the approaches. Unlike the former approach, the researcher puts a restriction to the determination of concepts by the respondents. Although it puts an end to the diversity of the knowledge in the study, it still is very efficient in the context of the time required for building a model of the system.
Soon after the concepts are determined in the open concept design approach or in the pre-concept design approach, the participants are asked to indicate the relationship between the concepts, following a continuum, i.e., 1-2: Very low; 3-4: Low; 5-6: Moderate; 7-8: High; 9-10: Very high. Participants can be either asked to draw maps, after providing them with the basic knowledge of mapping, or maps can be drawn by the researcher with the help of software based on the causal links the participants have indicated. Values of the causal link are hereafter normalized between -1 and +1.
Coding of individual FCMs into adjacency matrices
Individual FCMs are then coded into matrices in a spreadsheet, with all the concepts used in the analysis listed in both column and row, forming a square adjacency matrix (Singh and Chudasama 2017b; Singh and Nair 2014). Values of the link between the concepts should be normalized between -1 and +1; with -1 indicating a strong negative relationship and +1 indicating a strong positive relationship.
Quantitative aggregation of individual FCMs
Matrices of individual FCMs are then quantitatively aggregated to form the matrix for mapping, and the map formed based on this matrix is known as Social Cognitive Map. This enables a superior representation of the system with more reliable results.
Qualitative aggregation of Social Cognitive Maps
Maps with large number of concepts and sub-concepts become a hindrance in gaining insights from the map. So it is essential to aggregate them qualitatively into a fewer number of concepts and the approach helps in simplification of the Social Cognitive Map. Concepts are aggregated into categories under a broad concept; however, care must be taken so that the type of relationship between any pair of concepts does not get distorted after aggregation.
Network analysis
Network analysis of the final product is carried out with the help of various software; and notable parameters considered for analyzing the network includes degree centrality (includes both indegree centrality and outdegree centrality), betweenness centrality, closeness centrality, etc. Nodes in the network are also categorized into driver, receiver and transmitter based on their linkages with other nodes.
Scenario analysis
Scenario analysis asks ‘What if’ type of questions, regarding the behaviour of the system, to be specific, behaviour of the concepts and sub-concepts included in the system, under various contexts. Concepts with highest centrality values are selected, and their initial values are activated (value of ‘1’: activated; value of ‘0’: deactivated), and then the values of all other concepts in the system are observed, leading to the formation of a scenario. This analysis is carried out several times in order to gain insights into the types of possible scenarios that can be observed. This also helps in having comprehensive clarity on the need of the system as well as any shortage in terms of adoption and adaptation prevalent in the system.
EXAMPLE OF THE FUZZY COGNITIVE MAPPING APPROACH
A snippet of a Fuzzy Cognitive Map as obtained by Singh and Chudasama (2021) is given in Figure 4. The study was done across 12 arid and semi-arid districts for evaluating the effectiveness of several adaptation pathways. Data was collected with the help of FCM developed by 427 community groups, each group containing four to five members each. Maps were developed based on the concepts of perceived impacts of climate-related disasters and adaptation measures implemented to cope with the impacts of climate change. Social Cognitive Map developed from the study is explained in Figure 4.
From the figure we can see that the map consists of several types of nodes, such as climate stressors, climate-related impact and adaptation measures (water management, rejuvenation of soil ecosystem, production enhancement, institutional effectiveness). These nodes were linked to each other with the help of edges, with weights assigned to them. Let’s try to briefly interpret this SCM, bearing in mind some of the concepts mentioned in the map.
Livestock productivity (C8) was getting affected due to climatic extremes (C2) as well as bigger climatic variability (C1). Negative weights assigned on the edges between C1 and C2 to C8 explains the negative relationship existing between them. Further, degradation of forest (C5), an impact of climate change in the area was also hampering livestock productivity. This again was proving to be a major cause for economic poverty (C11) of the community belonging to arid and semi-arid regions. Economic poverty was also due to declining agricultural productivity (C7) in the region. Agricultural productivity was also getting affected due to climatic extremes, increased climate variability and land degradation (C4) and pest invasion (C6). For coping with this effect, respondents followed several adaptation measures. Improvement in quality of water and increasing its availability (C3) was supporting livestock productivity as well as agricultural productivity in the region. Rainwater harvesting (C12), watershed management approach (C13), micro-irrigation measures (C15), sustainable agricultural practices (C18), crop intensification by climate resilient varieties (C19) and other resource saving measures (C21) proved to be beneficial in improving agricultural productivity despite severe climate change impacts. Improvement in agricultural productivity was also positively impacting the livestock productivity of the region. Good agricultural and livestock productivity in the region had a particularly positive impact on the food and fodder security (C9) of the community in arid and semi-arid regions. Positive value assigned on the edges connecting these nodes showed a positive relationship existing between the concepts.
Effectiveness of various adaptation pathways was also measured in the study with the help of scenario analysis. Twelve different scenarios for different adaptation pathways were developed based on the categories of interventions and combinations. Results of each of these scenarios were compared to the baseline scenario for evaluating adaptation pathways. Scenarios were classified into various categories, such as least effective adaptation pathways, low effective adaptation pathways, moderately effective adaptation pathways, effective adaptation pathways and highly effective adaptation pathways (Singh and Chudasama 2021).
SOFTWARE USED IN CONDUCTING FUZZY COGNITIVE MAPPING ANALYSIS
There are a number of software available for carrying out FCM. Most popular software among them is:
- Mental modeler (mentalmodeler.com)
- FCMapper (http://www.fcmappers.net/joomla/)
- FCM Bridge (FCM Bridge (midasuser.com)).
Analysis can also be done using R programming (Dikopoulou et al. 2018) and Python (Mkhitaryan et al. 2021).
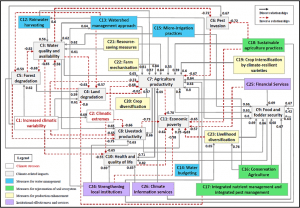 Figure 4: Social Cognitive Map illustrating perception of respondents on climate change impacts and adaptation measures.
Source: Singh and Chudasama (2021)
CONCLUSION
The Fuzzy Cognitive Mapping approach is now being used extensively across the globe as one of the most prominent and useful methodologies in carrying out research in the Social Sciences. It investigates the system and considers all of it for research, unlike pure quantitative methods where major focus is on selected aspects. This gives the methodology an edge over others and enables the method to become a boon for research in agricultural extension involving stakeholder’s belief, perception and knowledge for evidence-based decision making. We believe proper use and implementation of FCM can open up a new paradigm of agricultural extension research soon.
REFERENCES
Alomia-Hinojosa V, Groot JCJ, Andersson JA, Speelman EN, McDonald AJ and Tittonell P. 2022. Assessing farmer perceptions on livestock intensification and associated trade-offs using fuzzy cognitive maps; A study in mixed farming systems in the mid-hills of Nepal. Systems Research and Behavioral Science. https://doi.org/10.1002/sres.2830
Averbuch B, Thorsøe MH and Kjeldsen C. 2022. Using fuzzy cognitive mapping and social capital to explain differences in sustainability perceptions between farmers in the Northeast US and Denmark. Agriculture and Human Values 39(1):435–453. https://doi.org/10.1007/s10460-021-10264-4
Barbrook-Johnson P and Penn AS. 2022. Introduction. Pages 1-19 in Systems mapping. Palgrave Macmillan, Cham. https://doi.org/10.1007/978-3-031-01919-7_1
Dikopoulou Z, Papageorgiou E, Jetter A and Bochtis D. 2018. Open source tool in R language to estimate the inference of the Fuzzy Cognitive Map in environmental decision making. In International Congress on Environmental Modelling and Software. https://scholarsarchive.byu.edu/iemssconference/2018/Stream-C/84
Furman KL, Aminpour P, Gray SA and Scyphers SB. 2021. Mental models for assessing coastal social-ecological systems following disasters. Marine Policy 125:104334. https://doi.org/10.1016/J.MARPOL.2020.104334
Goswami R and Roy K. 2021. Mental modelling for the researchers of extension science: A primer. Pages 95-104 in Psychometric scale construction techniques: Basics to advances (Maiti S, Garai A Mohammad and Kadian KS, eds.). (1st ed., Vol. 1.) India: National Dairy Research Institute. https://www.researchgate.net/publication/351103337_Mental_modelling_for_the_researchers_of_extension_science_A_primer
Goswami R, Roy K, Dutta S, Ray K, Sarkar S, Brahmachari K, Nanda MK, Mainuddin M, Banerjee H, Timsina J and Majumdar K. 2021. Multi-faceted impact and outcome of COVID-19 on smallholder agricultural systems: Integrating qualitative research and fuzzy cognitive mapping to explore resilient strategies. Agricultural Systems 189. https://doi.org/10.1016/j.agsy.2021.103051
Gray SA, Gray S, De Kok JL, Helfgott AER, O’dwyer B, Jordan R, Nyaki A, 2015. Using fuzzy cognitive mapping as a participatory approach to analyze change, preferred states, and perceived resilience of social-ecological systems. Ecology and Society, 20(2):11. https://doi.org/10.5751/ES-07396-200211
Kok K. 2009. The potential of Fuzzy Cognitive Maps for semi-quantitative scenario development, with an example from Brazil. Global Environmental Change 19(1):122–133. https://doi.org/10.1016/J.GLOENVCHA.2008.08.003
Martinez P, Blanco M and Castro-Campos B. 2018. The water-energy-food nexus: A fuzzy-cognitive mapping approach to support nexus-compliant policies in Andalusia (Spain). Water (Switzerland) 10(5). https://doi.org/10.3390/w10050664
Meadows DH. 2009. Thinking in systems (Wright Diana ed.). Earthscan. https://research.fit.edu/media/site-specific/researchfitedu/coast-climate-adaptation-library/climate-communications/psychology-amp-behavior/Meadows-2008.-Thinking-in-Systems.pdf
Mehryar S, Sliuzas R, Sharifi A, Reckien D and van Maarseveen M. 2017. A structured participatory method to support policy option analysis in a social-ecological system. Journal of Environmental Management 197:360–372. https://doi.org/10.1016/j.jenvman.2017.04.017
Mkhitaryan S, Giabbanelli PJ, Wozniak MK, Napoles G, de Vries NK and Crutzen R. 2021. FCMpy: A Python module for constructing and analyzing Fuzzy Cognitive Maps. https://doi.org/10.48550/arxiv.2111.12749
Murphy R, Estabrooks A, Gauvin J, Gray S, Kroska AC, Wolf N and Harris BP. 2021. Using mental models to quantify linear and non-linear relationships in complex fishery systems. Marine Policy 132:104695. https://doi.org/10.1016/J.MARPOL.2021.104695
Özesmi U and Özesmi SL. 2004. Ecological models based on people’s knowledge: A multi-step fuzzy cognitive mapping approach. Ecological Modelling 176(1–2):43–64. https://doi.org/10.1016/J.ECOLMODEL.2003.10.027
Singh PK and Chudasama H. 2017a. Pathways for drought resilient livelihoods based on people’s perception. Climatic Change 140(2):179–193. https://doi.org/10.1007/S10584-016-1817-8/TABLES/1
Singh PK and Chudasama H. 2017b. Assessing impacts and community preparedness to cyclones: A fuzzy cognitive mapping approach. Climatic Change 143(3–4):337–354. https://doi.org/10.1007/S10584-017-2007-Z/TABLES/1
Singh PK and Chudasama H. 2020. Evaluating poverty alleviation strategies in a developing country. PLOS ONE 15(1):e0227176. https://doi.org/10.1371/JOURNAL.PONE.0227176
Singh PK and Chudasama H. 2021. Pathways for climate change adaptations in arid and semi-arid regions. Journal of Cleaner Production 284:124744. https://doi.org/10.1016/J.JCLEPRO.2020.124744
Singh PK and Nair A. 2014. Livelihood vulnerability assessment to climate variability and change using fuzzy cognitive mapping approach. Climatic Change 127(3–4):475–491. https://doi.org/10.1007/S10584-014-1275-0/FIGURES/4
Singh PK, Papageorgiou K, Chudasama H and Papageorgiou EI. 2019. Evaluating the effectiveness of climate change adaptations in the world’s largest mangrove ecosystem. Sustainability 11(23):6655. https://doi.org/10.3390/SU11236655
van der Sluis T, Arts B, Kok K, Bogers M, Busck AG, Sepp K, Loupa-Ramos I, Pavlis V, Geamana N and Crouzat E. 2018. Drivers of European landscape change: Stakeholders’ perspectives through Fuzzy Cognitive Mapping. Landscape Research 44(4):458–476. https://doi.org/10.1080/01426397.2018.1446074
Williams B and Hummelbrunner R. 2011. Systems concepts in action: A practitioner’s toolkit. Stanford, CA: Stanford Business Books. https://www.sup.org/books/title/?id=18331
White SC and Jha S. 2014. The ethical imperative of qualitative methods: Developing measures of subjective dimensions of well-being in Zambia and India. Ethics and Social Welfare 8(3):262–276. https://doi.org/10.1080/17496535.2014.932416
 Amitava Panja, PhD Scholar, Dairy Extension Division, ICAR-National Dairy Research Institute, Karnal. He can be reached at amitavapanja3@gmail.com
 Shravani Sahani, PhD Scholar, Dairy Extension Division, ICAR-National Dairy Research Institute, Karnal. She can be reached at shravani.mama@gmail.com
 Dr. Sanchita Garai, Senior Scientist, Dairy Extension Division, ICAR-National Dairy Research Institute, Karnal. She can be reached at sanchita.bckv@gmail.com
 Dr. Sanjit Maiti, Senior Scientist, Dairy Extension Division, ICAR-National Dairy Research Institute, Karnal. He can be reached at sanjit.ndri@gmail.com

Very useful blog focusing on an emerging method of extension research. By outlining the basics, application contexts, and softwares, it informs the reader, where to start with in using FCM. Besides, the blog supports the argument of using qualitative methods and its importance in the field of a behavioural science like agricultural extension. Many thanks to the authors and AESA.